“Understanding market direction becomes easier when you learn how price changes from one trend to another.”
The financial market moves in cycles of expansion, pullback, reversal, and continuation. Traders who understand these cycles can identify high-probability opportunities and avoid entering trades too late. One of the most important concepts used in modern price action trading is Market Structure Shift (MSS).
Learning how to identify an MSS can improve your trading decisions and help you recognize when buyers or sellers are gaining control. Whether you trade forex, stocks, cryptocurrencies, indices, or commodities, understanding market structure allows you to read price movement with confidence. If you want to reduce emotional trading and improve your analysis skills, mastering this concept is an important step.
This guide explains what Market Structure Shift (MSS) means, why it matters, how it forms, and how traders use it in real market conditions. You will also learn the difference between MSS, Break of Structure (BOS), and Change of Character (CHOCH) with simple examples.
1. What Is Market Structure Shift (MSS)?
- Market Structure Shift (MSS) happens when price changes direction after breaking an important swing level.
- It signals that the current trend may be losing momentum.
- An MSS often appears before a major market reversal.
- The concept is widely used in price action trading.
- Many traders use MSS to identify early entries.
- A bullish MSS suggests buyers are gaining control.
- A bearish MSS suggests sellers are becoming stronger.
- The shift usually happens after a failed continuation move.
- Price breaks a significant high or low with momentum.
- This break changes the short-term market direction.
- MSS can appear on any timeframe.
- Higher timeframe signals are usually stronger.
- Volume often increases during a valid MSS.
- Traders combine MSS with support and resistance.
- Understanding MSS helps traders avoid trading against the trend.
2. Understanding Market Structure Basics
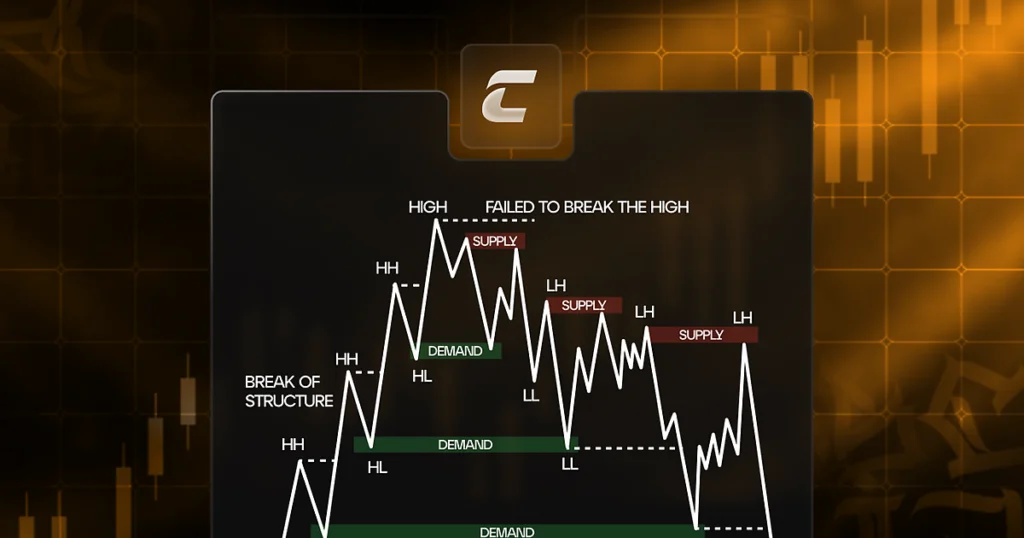
- Market structure refers to the pattern of highs and lows.
- An uptrend creates higher highs and higher lows.
- A downtrend creates lower highs and lower lows.
- A ranging market moves sideways.
- Swing highs act as temporary resistance.
- Swing lows act as temporary support.
- These levels show the battle between buyers and sellers.
- Price movement creates visible market patterns.
- Trend direction depends on these patterns.
- Breaking structure often signals change.
- Strong trends maintain their structure consistently.
- Weak trends struggle to create new highs or lows.
- Market structure works in all financial markets.
- Traders use structure to plan entries and exits.
- Understanding these basics makes MSS easier to identify.
3. Why Market Structure Shift Matters
- Many traders enter trades too late.
- MSS helps identify potential reversals early.
- It provides better risk-to-reward opportunities.
- Traders can use tighter stop losses.
- MSS reduces emotional decision-making.
- It helps traders follow objective rules.
- The concept works with multiple trading styles.
- Day traders use MSS for intraday setups.
- Swing traders use MSS for larger moves.
- Scalpers use lower timeframe MSS signals.
- MSS improves trade timing.
- It helps traders avoid false breakouts.
- Understanding market shifts increases confidence.
- It provides a clear framework for analysis.
- Professional traders often build strategies around market structure.
4. Key Components of Market Structure Shift
- A valid MSS starts with an existing trend.
- The second element is a significant swing point.
- Price must show signs of weakness.
- Liquidity is often taken before the shift occurs.
- Strong momentum confirms the structure break.
- A candle close beyond the swing level is important.
- Retests improve trade entries.
- Volume can provide extra confirmation.
- Market context should support the setup.
- Higher timeframe analysis increases accuracy.
- Imbalances may appear after the shift.
- Order blocks often form near MSS zones.
- Proper risk management remains essential.
- Multiple confirmations increase probability.
- All components together create stronger setups.
5. Bullish Market Structure Shift Example
- A bullish MSS usually appears during a downtrend.
- Price forms lower highs and lower lows.
- Sellers control the market initially.
- Price reaches a strong support zone.
- Selling momentum begins to weaken.
- A higher low starts to form.
- Price breaks above the previous lower high.
- This break signals a bullish MSS.
- Buyers begin taking control.
- Volume may increase during the breakout.
- Traders often wait for a pullback.
- The retest offers a lower-risk entry.
- Stop losses are placed below the higher low.
- Profit targets can follow resistance levels.
- The market may continue creating higher highs.
6. Bearish Market Structure Shift Example
- A bearish MSS appears during an uptrend.
- Price creates higher highs and higher lows.
- Buyers dominate the market.
- Price reaches a strong resistance area.
- Buying pressure starts to weaken.
- A lower high begins to form.
- Price breaks below the previous higher low.
- This break confirms a bearish MSS.
- Sellers gain control of the market.
- Momentum often increases during the decline.
- Traders wait for a retest.
- The retest creates a better entry point.
- Stop losses are placed above the lower high.
- Targets can be set at support levels.
- Prices may continue forming lower lows.
7. Difference Between MSS and Break of Structure (BOS)
- Many beginners confuse MSS with BOS.
- Both concepts involve structure breaks.
- A Break of Structure (BOS) confirms trend continuation.
- MSS often signals a potential reversal.
- BOS follows the current trend direction.
- MSS moves against the existing trend.
- A bullish BOS happens in an uptrend.
- A bearish BOS happens in a downtrend.
- MSS changes market control.
- BOS confirms existing control.
- Understanding the difference improves accuracy.
- Both concepts work together.
- Traders often identify MSS before BOS.
- Learning both concepts creates a complete framework.
- Proper context is essential when using both concepts.
8. Difference Between MSS and Change of Character (CHOCH)
- MSS and CHOCH are closely related concepts.
- Many traders use these terms differently.
- CHOCH often provides the first warning signal.
- MSS offers stronger confirmation.
- CHOCH can occur before MSS.
- MSS usually involves a more significant break.
- Both indicate possible reversals.
- Market context determines their importance.
- Higher timeframe levels increase reliability.
- Liquidity grabs often happen before CHOCH.
- Momentum strengthens during MSS.
- Combining both concepts improves analysis.
- Neither signal guarantees success.
- Risk management is always necessary.
- Understanding these differences reduces confusion.
9. How to Identify MSS Step by Step

- Start by identifying the current market trend.
- Mark important swing highs and swing lows.
- Determine whether the market is trending or ranging.
- Look for signs of weakening momentum.
- Watch for liquidity grabs above highs or below lows.
- Wait for price to attack a key structure level.
- Confirm a strong break of structure.
- Ensure the candle closes beyond the swing point.
- Check whether the move has strong momentum.
- Use higher timeframe analysis for confirmation.
- Wait for a pullback or retest.
- Identify nearby support or resistance zones.
- Calculate your risk-to-reward ratio.
- Place your stop loss at a logical level.
- Follow your trading plan without emotional decisions.
10. Best Timeframes for Trading MSS
- MSS works on every timeframe.
- Higher timeframes usually provide stronger signals.
- The daily chart offers the overall market direction.
- The four-hour chart is popular among swing traders.
- The one-hour chart suits active traders.
- Lower timeframes generate more trading opportunities.
- Lower timeframes also create more market noise.
- Many traders use multiple timeframe analysis.
- Higher timeframes provide market context.
- Lower timeframes help improve entries.
- A top-down approach increases accuracy.
- Avoid trading without higher timeframe confirmation.
- Choose timeframes that match your lifestyle.
- Consistency matters more than timeframe selection.
- Focus on quality setups instead of quantity.
11. Combining MSS with Other Trading Tools
- MSS becomes stronger when combined with confirmation tools.
- Support and resistance improve trade quality.
- Trendlines help identify market direction.
- Moving averages add trend confirmation.
- Volume analysis measures market participation.
- Fibonacci retracement levels highlight pullback zones.
- Supply and demand areas are useful.
- Order blocks can improve entry timing.
- Candlestick patterns add extra confirmation.
- Liquidity zones attract price movement.
- Imbalances show market inefficiencies.
- Multiple confirmations increase probability.
- Avoid using too many indicators.
- Keep your charts clean and simple.
- Focus on high-quality trading setups.
12. Common Mistakes Traders Make with MSS
- Many traders enter trades too early.
- Some ignore the higher timeframe trend.
- Others mistake minor swings for major structure.
- False breakouts often create losses.
- Trading without confirmation increases risk.
- Poor risk management damages accounts.
- Overtrading reduces consistency.
- Ignoring market context leads to mistakes.
- Chasing prices results in poor entries.
- Wide stop losses increase risk exposure.
- Emotional trading affects decision-making.
- Using excessive leverage is dangerous.
- Lack of patience creates unnecessary losses.
- Every setup does not require action.
- Discipline is essential for long-term success.
13. Risk Management When Trading MSS
- Risk management protects trading capital.
- Never risk too much on one trade.
- Many professional traders risk only 1% per trade.
- Use logical stop-loss placement.
- Position size should match your risk tolerance.
- Avoid moving stop losses emotionally.
- Maintain a positive risk-to-reward ratio.
- A 1:2 ratio is commonly used.
- Diversify your trading opportunities.
- Keep a detailed trading journal.
- Review your winning trades regularly.
- Study your losing trades carefully.
- Focus on long-term consistency.
- Protecting capital is more important than quick profits.
- Strong risk management supports trading success.
14. Real Trading Example of MSS
- Imagine the market is in a clear downtrend.
- Price creates lower highs and lower lows.
- The market approaches a strong support area.
- Sellers push prices below the previous low.
- This move collects liquidity from stop losses.
- Buyers quickly enter the market.
- Price starts forming a higher low.
- A strong bullish candle breaks the previous lower high.
- This break confirms a bullish MSS.
- Traders wait for a pullback to the broken level.
- The retest provides a lower-risk entry.
- Stop losses are placed below the higher low.
- Profit targets are set at the next resistance zone.
- Price continues creating higher highs.
- The trade follows the new market direction.
15. Conclusion
- Market Structure Shift (MSS) helps traders identify changes in market direction.
- It provides early signs of possible reversals.
- MSS works in forex, stocks, cryptocurrencies, indices, and commodities.
- Understanding market structure improves decision-making.
- Traders should first learn highs and lows.
- Higher timeframe analysis increases accuracy.
- Combining MSS with other tools improves results.
- Patience is necessary when waiting for confirmation.
- Risk management is essential for long-term growth.
- No trading setup guarantees success.
- Focus on probability instead of certainty.
- Keep a trading journal to track progress.
- Practice identifying MSS on historical charts.
- Build a strategy based on clear rules.
- Consistency and discipline are the keys to becoming a successful trader.
FAQs About Market Structure Shift (MSS)
1. What is a Market Structure Shift (MSS) in trading?
A Market Structure Shift (MSS) is a change in market direction that happens when price breaks an important swing high or swing low. It signals that buyers or sellers may be taking control and that a new trend could begin.
2. What is the difference between MSS and Break of Structure (BOS)?
A Break of Structure (BOS) usually confirms that the current trend will continue, while an MSS often signals a possible trend reversal. MSS focuses on a shift in market control, whereas BOS confirms the existing direction.
3. Can beginners use Market Structure Shift?
Yes. MSS is beginner-friendly because it focuses on simple price action concepts such as higher highs, higher lows, lower highs, and lower lows. New traders should practice identifying these patterns on historical charts before trading with real money.
4. Which timeframe is best for MSS trading?
MSS works on all timeframes, but many traders prefer the 4-hour, 1-hour, and daily charts because they provide clearer market structure. Lower timeframes offer more trading opportunities but may create more false signals.
5. Does MSS work in all financial markets?
Yes. Traders use Market Structure Shift in forex, stocks, cryptocurrencies, indices, commodities, and futures markets. Since MSS is based on price action, it can be applied to any market with sufficient liquidity.
Conclusion
Understanding Market Structure Shift (MSS) can help traders identify potential trend reversals before major market moves happen. By learning how to read higher highs, higher lows, lower highs, and lower lows, traders can better understand who controls the market at any given time. An MSS provides valuable insight into changing market sentiment and helps traders make more informed decisions.
However, an MSS should not be used as a standalone signal. Combining it with support and resistance levels, volume analysis, order blocks, liquidity zones, and proper risk management can improve trading accuracy. Traders should also analyze multiple timeframes to confirm market direction and avoid false signals.
Like any trading concept, mastering MSS requires practice, patience, and discipline. Spend time reviewing historical charts, recording your trades, and following a clear trading plan. With consistent practice and strong risk management, Market Structure Shift can become a powerful tool for identifying high-probability trading opportunities across forex, stocks, cryptocurrencies, indices, and commodities.